
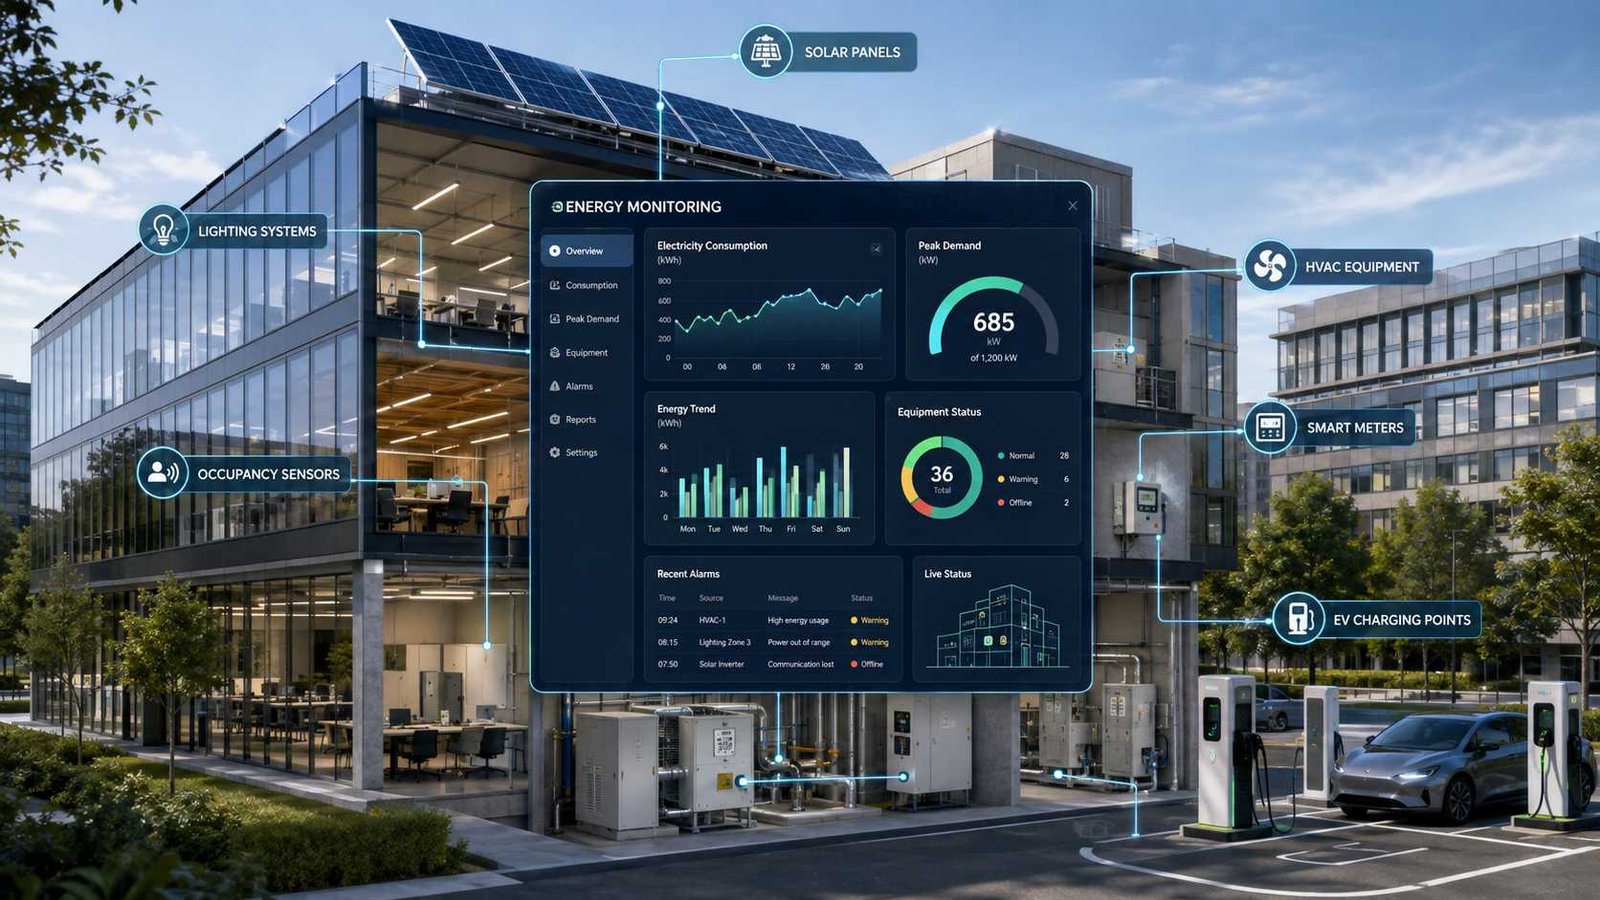
That visibility matters more as buildings become increasingly electrified. According to the International Energy Agency, buildings account for around 30% of global energy demand. Residential buildings make up about 70% of building energy demand, while commercial and public buildings account for the remaining 30%. The IEA also reported that the buildings sector produced nearly 45% of the worldwide increase in electricity demand during 2025.
Energy monitoring no longer means installing one meter at the main electrical panel. Modern systems can combine smart meters, submeters, IoT sensors, HVAC information, solar generation, battery data, occupancy readings, and utility prices in one dashboard. More advanced platforms can detect abnormal consumption, compare buildings, forecast demand, and even recommend changes automatically.
Here’s what matters: monitoring alone does not save energy. It gives people the information needed to find waste and verify whether their improvements actually work.
What Is a Building Energy Monitoring System?
A building energy monitoring system is a combination of measuring devices, communication equipment, software, and dashboards used to track how a building consumes energy. Depending on the installation, it may monitor the entire property or break consumption down by floor, department, tenant, circuit, equipment type, or individual machine.
The U.S. Department of Energy uses the broader term Energy Management Information System, or EMIS, for technologies that monitor, analyze, and sometimes control metered building energy use and system performance. DOE describes an EMIS as a combination of devices, data services, and software applications that brings facility data together so energy managers can improve performance at building, campus, or organization level.
A basic system may track only kilowatt-hours. A more capable installation can measure current, voltage, power demand, power factor, gas, water, HVAC load, temperature, humidity, occupancy, solar output, and battery performance. The software stores this information and turns thousands of measurements into charts, comparisons, alarms, and key performance indicators.
Think of the difference between a utility bill and an energy monitoring system as the difference between a bank statement and live transaction alerts. Your utility bill tells you how much energy you used during the billing period. Energy monitoring helps show when, where, and sometimes why that consumption happened.
That difference becomes important when a building contains multiple energy-intensive systems. If monthly electricity use rises by 12%, the bill alone cannot tell you whether HVAC, lighting, refrigeration, EV chargers, or office equipment caused the increase. Submetering and analytics can narrow the problem much faster.
How Does a Building Energy Monitoring System Work?
Every energy monitoring system follows the same basic process even if the hardware and software differ. First, meters and sensors measure energy-related conditions. A smart electrical meter may record kilowatt-hours and peak demand, while a temperature sensor records room conditions. Submeters can separate HVAC consumption from lighting or measure different floors. Current transformers can measure the current flowing through selected electrical conductors without requiring a separate utility meter for every circuit.
Next, the system collects those measurements. A gateway, controller, data logger, or building automation server may receive information from dozens or hundreds of field devices. Common communication technologies include Ethernet, Wi-Fi, Modbus, BACnet, MQTT, and various wireless IoT technologies. The correct choice depends on existing equipment, distance, reliability needs, cybersecurity requirements, and whether the building already has a building management system.
The information then moves to local software, a cloud platform, or a hybrid system. Software converts raw measurements into usable information. For example, it can compare today’s HVAC consumption with yesterday’s, calculate the energy used per square meter, identify the highest-demand period, or flag an unusual increase after normal operating hours.
The final stage is action. A facility manager might change an HVAC schedule, investigate a faulty pump, move EV charging away from peak hours, or check why one floor consumes more electricity than similar floors.
The practical workflow is simple:
Measure energy, collect data, analyze performance, identify a problem, take action, and verify the result.
A good monitoring system keeps repeating that cycle.
Main Components of a Building Energy Monitoring System
You do not need the most complex hardware to start monitoring energy. The important part is matching each component to a clear measurement goal.
| Component | Main Job | Why It Matters |
|---|---|---|
| Smart energy meter | Measures total electrical use | Establishes overall consumption |
| Submeter | Measures a circuit, floor, tenant, or equipment group | Locates where energy is being used |
| Current transformer | Measures electrical current | Enables circuit-level monitoring |
| Environmental sensor | Measures temperature, humidity, occupancy, or other conditions | Explains why energy demand changes |
| Gateway or controller | Collects information from field devices | Connects meters and sensors to software |
| Communication network | Transfers measurements | Keeps data flowing reliably |
| Local or cloud server | Stores and processes information | Provides historical analysis |
| Energy software | Analyzes consumption and performance | Finds trends, waste, and abnormal behavior |
| Dashboard | Presents KPIs and alarms | Helps people make decisions |
The best installations also collect context. Electricity consumption alone can be misleading. An office may use more cooling energy because outside temperature increased sharply, not because the HVAC system developed a fault. Similarly, one retail branch may consume more energy because it stays open four hours longer than another.
This is why modern platforms increasingly combine meter readings with weather, occupancy, schedules, utility tariffs, and equipment operating information. Siemens Building X Energy Manager, for example, supports energy data, costs, historical trends, baselines, KPIs, benchmarking, and contextual information such as occupancy and weather. That illustrates where commercial energy platforms are moving: from simple metering toward operational intelligence.
What Is a BMS System in a Building?
A Building Management System, or BMS, controls and supervises building equipment. You may also see the term Building Automation System, or BAS. The exact terminology varies between manufacturers and regions, but both commonly refer to systems that connect controllers, sensors, software, and equipment so building operations can be monitored and controlled centrally.
NIST classifies a building automation system as a form of operational technology. It notes that a BAS can control systems including heating, ventilation and air conditioning, electrical equipment, lighting, fire systems, physical security, access control, and other utilities. It can also record historical information and issue equipment alarms.
A BMS might start an air-handling unit at 7:00 a.m., maintain a room temperature setpoint, turn lights off after business hours, control pumps, monitor equipment status, and notify the maintenance team if a device fails.
Energy monitoring has a different primary purpose. It focuses on measuring, analyzing, comparing, and understanding energy use. Modern BMS products increasingly include strong energy-monitoring features, so the boundaries overlap.
The simplest distinction is this:
A BMS mainly runs the building. An energy monitoring system mainly explains how the building uses energy.
A Building Energy Management System, or BEMS, combines more of both functions by linking building control with energy analysis and optimization.
Building Energy Monitoring System vs BMS vs BEMS vs EMS
The terms BMS, BAS, BEMS, EMS, EnMS, and EMIS often appear in the same project, which causes understandable confusion.
| System | Primary Purpose | Energy Monitoring | Equipment Control | Typical Application |
|---|---|---|---|---|
| Energy Monitoring System | Measure and analyze energy | Strong | Limited or none | Energy visibility |
| BMS/BAS | Operate building systems | Basic to advanced | Strong | HVAC and building control |
| BEMS | Manage building systems and energy | Strong | Strong | Smart energy-efficient buildings |
| EMIS | Analyze building energy and system performance | Strong | Optional | Buildings and portfolios |
| EnMS | Organizational energy-management framework | Depends on technology | Not necessarily | ISO 50001 programs |
| Power-system EMS | Monitor and optimize electrical networks | Strong | Strong | Utilities, grids, generation |
A small office may need only smart metering and a cloud dashboard. A large hospital, university, airport, hotel, or commercial tower may need a full BMS or BEMS because energy performance depends on hundreds of interacting assets.
This distinction also prevents a common purchasing mistake. A business sometimes buys an energy dashboard expecting it to control HVAC equipment automatically. Another buys a BMS and assumes it will automatically provide advanced cost analysis, benchmarking, and ISO 50001 reporting.
Before buying anything, write down whether you need measurement, analysis, control, optimization, or all four. That requirement should drive the system architecture.
What Is EMS in Power Systems?
In electrical engineering, EMS can mean something different from building energy management. A power-system Energy Management System helps operators monitor and manage generation, transmission, distribution, demand, and other electrical-network conditions.
A grid-level EMS may process information from SCADA systems, forecasts, substations, generators, and network models. Operators use that information to maintain reliable electrical service and balance supply with demand. Depending on the system, functions may include load forecasting, generation scheduling, network analysis, alarms, and operational optimization.
A building EMS operates on a much smaller scale. Instead of balancing an electrical grid, it focuses on energy performance inside one building or a portfolio of properties.
The easiest way to remember the difference is context. If the discussion involves a utility control room, power generation, transmission lines, or grid operations, EMS usually refers to a power-system Energy Management System. If the discussion involves HVAC, lighting, meters, offices, factories, campuses, or facility managers, EMS usually refers to building or organizational energy management.
Also watch for EnMS. ISO commonly uses EnMS to mean an Energy Management System as a management framework, rather than a particular software product.
What Problems Can Energy Monitoring Detect?
Energy monitoring becomes valuable when it converts an unusual number into a specific investigation.
| Problem | Likely Cause | Possible Impact |
|---|---|---|
| High overnight consumption | HVAC, lighting, or equipment left running | Continuous energy waste |
| Unexpected demand spike | Large equipment starting together | Higher peak-demand cost |
| Rising HVAC use | Poor scheduling, sensor problem, dirty equipment, weather | Increased operating cost |
| One floor consumes much more than another | Different schedules or inefficient equipment | Hidden performance issue |
| Solar output falls unexpectedly | Shading, inverter fault, dirt, or system problem | Reduced renewable generation |
| Poor power factor | Inductive electrical loads | Less efficient electrical operation |
| Weekend load remains high | Incorrect operating schedule | Unnecessary base load |
| Consumption slowly increases | Equipment performance drift | Growing cost that may go unnoticed |
Consider a simple example. A three-floor office normally consumes very little energy between midnight and 5:00 a.m. A new dashboard shows that the second floor suddenly starts drawing 18 kW throughout the night. Instead of waiting for the next electricity bill, the facility team can investigate the floor immediately. They may discover that an HVAC schedule was changed during maintenance and never restored.
The dashboard did not save the energy. It made the fault visible.
What Should an Energy Monitoring Dashboard Show?
A useful dashboard should answer operational questions quickly. It should show current consumption, daily and monthly trends, peak demand, energy cost where tariff information is available, and consumption by major system or location. Large sites may also need building-to-building benchmarking, energy use intensity, renewable generation, battery status, emissions-related metrics, and power-quality information.
Baselines make the dashboard far more useful. A baseline represents expected energy behavior under defined conditions. Software can then compare actual performance with expected performance and flag significant deviations. Better systems add context such as weather, occupancy, operating hours, and production levels so comparisons remain fair.
For example, an office using 20% more cooling energy than last month may look inefficient until the dashboard shows that cooling degree days also increased sharply. Conversely, an office consuming the same energy despite being half empty may have a serious scheduling problem.
Alerts should also be selective. If software sends hundreds of low-value alarms, users eventually ignore them. Set alerts around conditions people can actually investigate: unusually high overnight load, demand approaching a tariff threshold, loss of meter communication, unexpected equipment operation, or consumption outside an established baseline.
Modern commercial examples include Siemens Building X Energy Manager and Schneider Electric EcoStruxure Building Operation. Current versions emphasize real-time and historical data, dashboards, reporting, integration, analytics, and portfolio-level visibility rather than simple meter reading alone.
What Are the Main Benefits?
The first benefit is visibility. You cannot manage a hidden load effectively. Submetering can reveal which systems dominate consumption and whether they operate when they should.
The second benefit is faster fault detection. A failing fan, incorrect schedule, stuck control valve, or sensor problem can change an energy profile before someone reports a comfort problem. Monitoring gives facility teams another way to see equipment behavior.
Third, energy data helps verify projects. Suppose a company replaces old lighting with LEDs. Comparing bills before and after the upgrade can be misleading because occupancy, weather, and operating hours may also change. A monitoring system can isolate lighting circuits and provide a much clearer before-and-after comparison.
There is also evidence that analytics can produce measurable savings when organizations actually use the information. DOE’s Smart Energy Analytics Campaign covered thousands of commercial buildings. Its published results reported median annual energy savings of about 3% for energy information systems and 9% for fault detection and diagnostic deployments, with a median simple payback of about two years across participating projects. These findings come from the 2016–2020 campaign, so they should be treated as historical program evidence rather than a guarantee for a new 2026 installation.
The lesson is more useful than the percentage: analytics creates value when organizations connect information to operations and maintenance.
Three Real-World Energy Monitoring Examples
Small Office
A 30-person office installs a main smart meter plus submeters for HVAC, lighting, and general outlets. After two weeks, the manager finds that HVAC still consumes significant electricity for three hours after closing. The schedule is corrected. The office then watches the HVAC submeter to confirm that the overnight base load falls.
This is a hypothetical example, but it shows why a small business does not necessarily need a complex BMS. A few well-placed meters may provide enough information to address the largest loads.
Retail Store
A supermarket or convenience store has a different problem. Refrigeration runs around the clock, while lighting, cooling, signs, and other equipment follow schedules. A dashboard can compare nighttime base load, daytime demand, refrigeration consumption, and abnormal spikes. If refrigeration energy gradually rises without a similar change in weather or opening hours, maintenance staff have a reason to inspect equipment.
Large Commercial Portfolio
Large organizations can compare many buildings instead of analyzing each property separately. That makes benchmarking powerful. If ten similar buildings operate under similar conditions but one consistently uses far more energy per square meter, the difference deserves investigation.
A recent vendor-reported example also shows how systems are moving from monitoring toward automated optimization. Johnson Controls reported in August 2026 that DATEV used its Energy & Comfort Intelligence technology to reduce airside energy use by nearly 10% on applicable equipment while maintaining occupant comfort. Because this is a vendor-published case study, it should not be treated as an independent industry benchmark, but it demonstrates how real-time data and automated control can work together.
“The new OpenBlue Platform changes what a building can do on its own.”
— Jamie Cameron, Johnson Controls
How to Set Up a Building Energy Monitoring System
Start with the problem, not the dashboard. Decide whether you want to reduce electricity cost, track HVAC performance, allocate tenant energy use, manage peak demand, monitor solar generation, meet reporting requirements, or support a formal energy-management program.
Next, review at least 12 months of utility information where possible. Look for seasonality, unusual months, demand charges, and changes in operating hours. Then list the largest energy consumers. HVAC usually deserves attention in commercial buildings, but refrigeration, compressed air, electric heating, pumps, servers, manufacturing equipment, EV charging, or process loads may matter more in other facilities.
Choose metering points after understanding those loads. Whole-building monitoring provides the big picture, but submetering creates diagnostic value. There is little benefit in installing 100 meters if nobody knows why they exist. Name every meter clearly and document what it measures.
Then select communication and software architecture. Confirm whether existing meters, controllers, or BMS equipment support protocols such as BACnet or Modbus. Decide whether data will stay on-site, go to a cloud platform, or use a hybrid setup. Test connectivity before scaling the project.
Finally, create baselines and useful alerts. Review results on a fixed schedule. A small business may review weekly. A facility team may review daily. Large portfolios may use automated analytics continuously.
A practical implementation sequence is:
- Define the energy goal.
- Review existing bills and systems.
- Identify significant energy loads.
- Select metering points.
- Install meters and sensors.
- Connect gateways and communications.
- Configure dashboards and baselines.
- Set meaningful alerts.
- Investigate deviations.
- Verify savings after changes.
What Is the Purpose of ISO 50001?
ISO 50001 provides an international framework for establishing, implementing, maintaining, and continually improving an organizational Energy Management System, or EnMS. Its goal is systematic improvement in energy performance, including energy efficiency, energy use, and energy consumption.
The current base standard remains ISO 50001:2018. ISO reviewed and confirmed that edition in 2024, so it remains current in 2026. ISO also published ISO 50001:2018/Amd 1:2024, which adds climate-action changes.
ISO 50001 follows the Plan-Do-Check-Act approach. An organization establishes an energy policy, understands significant energy uses, defines objectives, creates energy baselines and Energy Performance Indicators, implements improvements, measures results, and reviews performance. The cycle then repeats.
A building energy monitoring system can support this process by providing measurements and evidence, but installing monitoring software does not make an organization ISO 50001 compliant or certified. ISO 50001 is technology-neutral and addresses the wider management system, including leadership, planning, objectives, operational controls, measurement, competence, review, and continual improvement.
The monitoring system is a tool. ISO 50001 provides the management framework that determines how an organization uses that tool.
Building Energy Monitoring and ISO 50001 in Practice
The relationship becomes clearer with a practical example. Imagine a university finds that cooling represents one of its significant energy uses. It establishes an energy baseline based on historical electricity consumption and relevant conditions. It then defines an Energy Performance Indicator for cooling performance.
Meters and BMS data continuously feed the monitoring platform. The energy team sees that one academic building uses more cooling energy than similar buildings. Investigation finds that its air-handling system starts much earlier than occupancy requires.
The university changes the operating schedule. Energy monitoring then shows whether cooling consumption falls while indoor comfort remains acceptable. Management reviews the measured result and decides whether to apply the same strategy elsewhere.
That is much closer to ISO 50001 thinking than simply installing a dashboard.
Organizations planning detailed building audits should also be aware of ISO 50002-2:2025, published in June 2025. It provides building-specific guidance for energy audits and covers areas such as HVAC, lighting, building envelopes, domestic hot water, automation, occupant behavior, and on-site generation. It complements the broader ISO 50002-1 audit requirements and can support an ISO 50001 energy review.
Security, Connectivity, and Data Protection
A connected building is also a networked operational environment. Energy meters may look harmless, but the same infrastructure can connect to controllers that influence HVAC, lighting, electrical equipment, access systems, and other physical operations.
NIST’s operational-technology guidance recommends a risk-based approach to protecting building automation systems. It also emphasizes segmentation and separation between IT and OT environments rather than treating every connected device as part of one flat network. Network zones, firewalls, controlled communication paths, authentication, and properly managed remote access can reduce unnecessary exposure.
Remote access deserves particular attention because vendors and maintenance teams may need to connect from outside the site. NIST recommends limiting remote access to justified business needs and considering protections such as secure connections, authentication, and multi-factor authentication.
For a practical building project, that means the energy-management team should involve IT or cybersecurity staff before connecting meters and gateways to corporate networks or the internet. Change default credentials. Remove unused accounts. Keep gateways and servers supported and updated. Restrict administrator privileges. Document data flows. Back up important configuration and historical information.
Cybersecurity should be part of the design, not something added after commissioning.
Cloud vs On-Premises Energy Monitoring
Cloud platforms are attractive because users can access dashboards from different locations, software updates can be easier to manage, and organizations can compare many buildings in one interface. They work particularly well for property portfolios, retail chains, campuses, and companies without large internal server teams.
On-premises systems keep more infrastructure inside the organization. Some operators prefer this model when sites have strict network requirements, limited internet connectivity, sensitive operational information, or existing local BMS infrastructure.
Neither approach is automatically more secure. Security depends on architecture, configuration, authentication, patching, network design, vendor practices, and how users manage access.
| Factor | Cloud | On-Premises |
|---|---|---|
| Remote access | Usually easy | Requires configuration |
| Local server management | Lower | Higher |
| Internet dependency | Higher | Lower |
| Multi-site scaling | Usually easier | Can require more infrastructure |
| Data control | Shared with platform architecture | Greater local control |
| Updates | Often vendor-managed | Often customer-managed |
| Best fit | Distributed portfolios | Sites requiring local control |
Hybrid designs are common because they allow local building control to continue even if an internet connection fails while higher-level analytics operate in the cloud.
AI and the Future of Building Energy Monitoring
The next stage of energy monitoring is not simply collecting more data. It is finding useful patterns faster.
Traditional monitoring depends heavily on people reviewing graphs. AI-assisted analytics can examine many variables at once and flag relationships that deserve attention. For example, software can compare cooling demand with weather, occupancy, time of day, historical performance, and equipment status rather than relying on one fixed threshold.
Predictive maintenance is another useful direction. A pump that gradually consumes more power while delivering the same output may be developing a mechanical issue. Analytics can alert maintenance teams before the change becomes a major failure.
Occupancy-aware control can reduce conditioning or lighting in lightly used areas while maintaining comfort where people are present. Forecasting can help buildings anticipate demand based on weather or operating schedules. Buildings with solar panels and batteries can use forecasts to decide when to store, consume, or export energy.
Current commercial platforms already show this shift. Johnson Controls announced additional AI capabilities for OpenBlue in August 2026, while Siemens Building X emphasizes predictive analysis, baselines, portfolio comparisons, and contextual data. Schneider Electric’s EcoStruxure platform combines building control, monitoring, analytics, and third-party integration.
The useful future is not a building full of flashy screens. It is a building that can detect waste earlier and make safe, explainable operating adjustments with less manual work.
How Much Does a Building Energy Monitoring System Cost?
There is no meaningful universal price for a building energy monitoring system. A small office monitoring one electrical panel is a completely different project from a hospital integrating hundreds of meters, HVAC controllers, backup generators, solar arrays, tenant billing, and cloud analytics.
Cost usually depends on the number of metering points, electrical-panel modifications, sensor accuracy, installation labor, communications, gateways, software licensing, BMS integration, cloud subscriptions, engineering time, cybersecurity requirements, and commissioning.
A basic project can reduce cost by starting with the main meter and the two or three largest loads. A growing business can add submeters later. Large facilities should think in terms of total project value rather than buying the cheapest meter, because poor integration and badly labeled data can make inexpensive hardware nearly useless.
When comparing proposals, ask vendors to separate one-time installation costs from recurring software, cloud, support, and maintenance charges. Also ask what happens if you change software providers later. Can the meters use standard protocols? Can historical data be exported? Does the system offer an API? Are you locked into one gateway manufacturer?
The financial case should focus on measurable problems. If the building has high peak-demand charges, frequent HVAC complaints, multiple tenants, major after-hours loads, or poor visibility across several sites, better monitoring can provide far more value than it does in a tiny property with very simple energy use.
How to Choose the Right System
Start with interoperability. A system that supports standard protocols and useful exports gives you more options later. Check compatibility with existing meters, BMS controllers, solar inverters, EV chargers, and other equipment before purchase.
Next, inspect the dashboard rather than accepting a feature list. Can a facility manager answer basic questions in less than a minute? Can users compare periods, buildings, or equipment? Can the system normalize information for weather or occupancy? Can it calculate costs using your tariff structure? Can alarms be adjusted without calling the vendor?
Scalability also matters. A five-meter pilot may become a 500-meter portfolio. Ask how the database, licensing, gateways, and reporting work as the project grows.
Cybersecurity questions should be part of vendor evaluation. Ask about authentication, multi-factor authentication, encryption, software updates, user roles, vulnerability handling, logging, backups, and remote-access controls.
Finally, determine who will own the energy data operationally. The best dashboard fails if nobody reviews it.
Practical Buying Checklist
- Define the energy problem before requesting quotations.
- Identify the building’s largest energy loads.
- Check compatibility with existing BMS and meters.
- Confirm BACnet, Modbus, MQTT, API, or other integration requirements.
- Decide whether you need cloud, on-premises, or hybrid deployment.
- Confirm historical data retention and export options.
- Check dashboard, alerts, baselines, and benchmarking features.
- Review cybersecurity and remote-access controls.
- Separate installation costs from recurring fees.
- Assign someone to review and act on the data.
Common Mistakes to Avoid
The biggest mistake is installing meters without deciding what question each meter should answer. Collecting more data is not automatically better. Every measurement point creates hardware, configuration, database, maintenance, and review requirements.
Another mistake is monitoring only whole-building consumption. A main meter can show that electricity use increased, but it cannot explain which system caused the increase. Strategic submetering provides much more diagnostic value.
Do not ignore context either. Weather, occupancy, opening hours, production levels, and special events can change consumption. Comparing raw kilowatt-hours without considering those variables can produce misleading conclusions.
Poor naming creates another long-term problem. Labels such as Meter 14 or Panel B may make sense during installation but become useless two years later. Use descriptive names and maintain a meter register.
Finally, do not assume the software will manage energy for you. Someone must investigate alerts, correct schedules, maintain equipment, verify savings, and update targets.
Energy monitoring works best as an ongoing management process rather than a one-time technology purchase.
Frequently Asked Questions
What is an energy monitoring system?
An energy monitoring system measures energy consumption and converts the measurements into usable information. It may include meters, sensors, gateways, software, dashboards, alerts, and analytical tools. Building systems can monitor overall electricity use or divide consumption by equipment, floor, tenant, department, or energy source.
What is a BMS system in a building?
A Building Management System controls and supervises equipment such as HVAC, lighting, pumps, electrical systems, alarms, and other building services. Modern BMS platforms may include energy analytics, but their main role traditionally focuses on building operations and control.
What is the purpose of ISO 50001?
ISO 50001 provides a framework for organizations to manage and continually improve energy performance. It helps organizations establish policies, objectives, energy baselines, Energy Performance Indicators, measurement processes, and continual-improvement practices. The current base edition is ISO 50001:2018, which remains current and has a 2024 climate-action amendment.
What is EMS in power systems?
In electrical power systems, an EMS is an Energy Management System used to monitor, analyze, and manage grid or power-network operations. It differs from a building EMS, which focuses on energy use inside facilities.
What is the difference between BMS and EMS?
A BMS focuses mainly on controlling building equipment. An energy monitoring or energy-management platform focuses more on measuring, analyzing, reporting, and optimizing energy use. Modern systems frequently combine both functions.
Can a building energy monitoring system reduce electricity bills?
It can help identify opportunities to reduce costs, but the system itself does not create savings. Savings occur when people or automated controls act on the information by fixing faults, changing schedules, reducing peak demand, improving equipment operation, or eliminating waste.
Can an existing building add energy monitoring?
Yes. Older buildings can often add smart meters, submeters, current transformers, IoT gateways, and software without replacing the entire building-management infrastructure. The best retrofit design depends on existing electrical panels, controllers, communications, and safety requirements.
Does a small business need a full BMS?
Not always. A small office, shop, café, or workshop may gain enough value from a main smart meter plus several strategic submeters and a simple dashboard. A full BMS becomes more useful when the business needs central control over HVAC, lighting, schedules, and multiple building systems.
Building Energy Monitoring System Checklist
Before considering the project complete, confirm the following:
- Energy objectives are documented.
- Utility bills and historical consumption have been reviewed.
- Major energy-consuming equipment has been identified.
- Main meters and required submeters are installed.
- Meter names and locations are documented.
- Data communication has been tested.
- Dashboards show useful KPIs rather than raw data alone.
- Energy baselines have been established.
- Abnormal-consumption alerts are enabled.
- Users have appropriate access levels.
- OT and IT cybersecurity requirements have been reviewed.
- Remote vendor access is controlled.
- Someone is responsible for reviewing energy performance.
- Corrective actions are documented.
- Savings are measured after improvements.
Useful Standards and Further Reading
Facility managers and organizations planning a deeper energy-management program should consider several authoritative resources. ISO 50001:2018 remains the central international Energy Management System standard, with its 2024 climate-action amendment. For energy audits, ISO now lists ISO 50002-1:2025 for general audit requirements, ISO 50002-2:2025 for buildings, and ISO 50002-3:2025 for processes.
The U.S. Department of Energy also provides EMIS guidance, implementation resources, and material from the Smart Energy Analytics Campaign. For cybersecurity, NIST SP 800-82 Rev. 3 provides detailed guidance for operational technology, including building automation systems.
These resources are particularly useful when a project moves beyond basic meter installation into formal energy audits, building automation, portfolio analytics, cybersecurity, or ISO 50001 implementation.
Final Thoughts Before You Monitor Your Building
A building energy monitoring system gives a building something a monthly utility bill cannot provide: visibility into how energy behaves over time and across different systems.
For a small business, that may mean discovering an air conditioner running every night. For a university, it may mean comparing dozens of buildings and finding the worst performers. For a large commercial portfolio, it may mean combining meters, BMS data, weather, occupancy, analytics, and automated controls in one energy-management strategy.
The technology is becoming more capable. Cloud dashboards can compare entire portfolios. AI can detect abnormal patterns. Building controls can respond to occupancy and weather. Solar, batteries, and EV charging can become part of the same energy picture.
But the basic rule has not changed.
Measure what matters. Understand why it changes. Act on what the data shows. Then measure again.
That cycle is where a building energy monitoring system creates real value.

Digital innovation analyst with a focus on AI, IoT, and connectivity. Maria’s articles combine data-driven research, industry statistics, and tested solutions, helping global readers stay informed, confident, and future-ready in technology.